Note
Go to the end to download the full example code
Example 4#
test

import numpy as np
import matplotlib.pyplot as plt
from mytoolbox.module1 import Circle

circles = np.array(
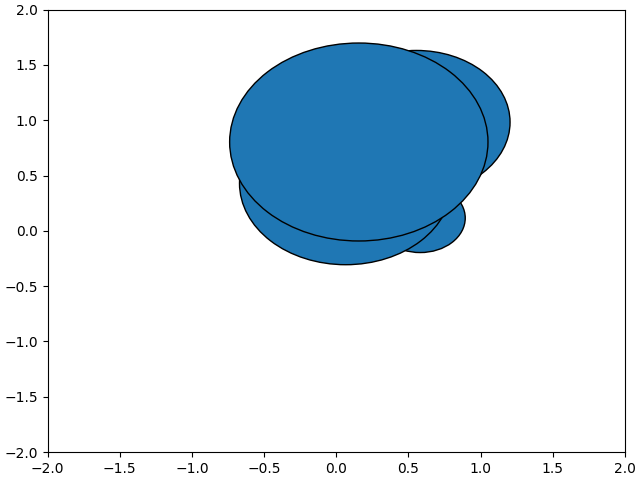
    [Circle(np.random.random((2,)), np.random.random_sample()) for i in range(5)]
)

fig, ax = plt.subplots(1, 1, layout="constrained")
for circle in circles:
    circle.plot(ax, edgecolor="k")

ax.set_xlim([-2, 2])
ax.set_ylim([-2, 2])
plt.show()
Total running time of the script: (0 minutes 0.137 seconds)