Note
Go to the end to download the full example code
Probes and velocity reconstruction#
import matplotlib.pyplot as plt
import numpy as np

from pyudv.geometry import Probe, sketch_probes, reconstruct_velocity


def U(z):
    u = 5 * (5 - z) ** 2
    v = u / 10
    U = np.array([u, v])
    return U
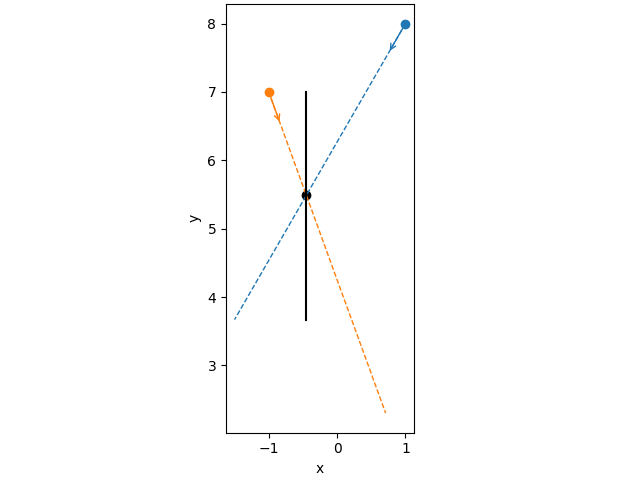
Define probes and plot them#
# define probes
r = np.linspace(0, 5, 100)
alpha1, alpha2 = -120, -70  # deg
O1, O2 = np.array([1, 8]), np.array([-1, 7])
probe1_pars = [r, alpha1, [0, O1]]
probe2_pars = [r, alpha2, [0, O2]]
#
probe1 = Probe(*probe1_pars)
probe2 = Probe(*probe2_pars)

fig, ax = plt.subplots(1, 1, layout="constrained")
sketch_probes(
    [probe1, probe2],
    combinations=[[0, 1]],
    combination_colors=["k"],
    ax=ax,
)
ax.set_xlabel("x")
ax.set_ylabel("y")
plt.show()
Create fake signal#
u1 = U(probe1.z).T @ probe1.unit_vec
u2 = U(probe2.z).T @ probe2.unit_vec
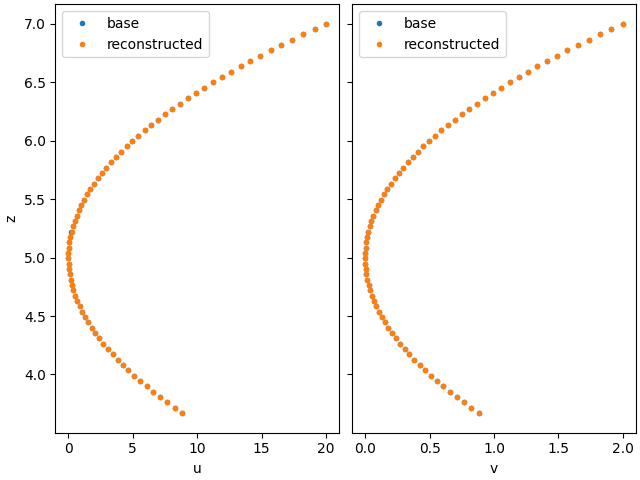
Velocity reconstruction#
U_rec, z_interp, X, dx_1, dx_2 = reconstruct_velocity(u1, u2, probe1, probe2)
U_th = U(z_interp)
#
fig, axarr = plt.subplots(1, 2, layout="constrained", sharey=True)
for ax, u_th, u_rec in zip(axarr, U_th, U_rec):
    ax.plot(u_th, z_interp, ".", label="base")
    ax.plot(u_rec, z_interp, ".", label="reconstructed")
    ax.legend()
axarr[0].set_xlabel("u")
axarr[1].set_xlabel("v")
axarr[0].set_ylabel("z")
plt.show()
Total running time of the script: (0 minutes 0.377 seconds)