Note
Go to the end to download the full example code
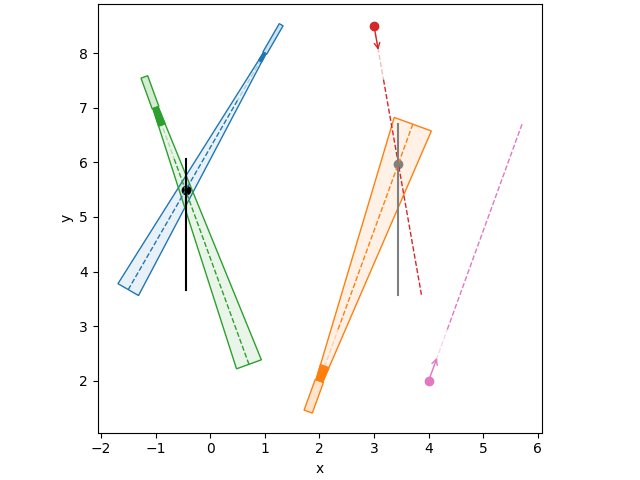
Sketch multiple probes#
import matplotlib.pyplot as plt
import numpy as np

from pyudv.geometry import MetFlowTransducers, Probe, sketch_probes

# ## define probes
r = np.linspace(1, 5, 100)  # beam radial coordiantes, same for all probes
alpha1, alpha2, alpha3, alpha4 = -120, -70, 70, -80  # probe inclinations in degree
# probe origin points
O1, O2, O3, O4 = (
    np.array([1, 8]),
    np.array([-1, 7]),
    np.array([2, 2]),
    np.array([3, 8.5]),
)
# probe parameters
PROBE_PARS = [
    [r, alpha1, [0, O1]],  # probe1
    [r, alpha2, [0, O2]],  # probe2
    [r, alpha3, [0, O3]],  # probe3
    [r, alpha4, [0, O4]],  # probe4
]
# transducers
transducers = [
    MetFlowTransducers[4], MetFlowTransducers[2], MetFlowTransducers[1], None
]

probes = [
    Probe(*probe_pars, transducer)
    for probe_pars, transducer in zip(PROBE_PARS, transducers)
]
probe_colors = ["tab:blue", "tab:green", "tab:orange", "tab:red"]
combinations = [(0, 1), (2, 3)]
combination_colors = ["k", "grey"]

fig, ax = plt.subplots(1, 1, layout="constrained")
sketch_probes(
    probes,
    combinations=combinations,
    probe_colors=probe_colors,
    combination_colors=combination_colors,
    ax=ax,
)

# adding another probe afterwards
probe_add = Probe(r, 70, [0, np.array([4, 2])])
probe_add.plot_probe(ax, color="tab:pink")

ax.set_xlabel("x")
ax.set_ylabel("y")
plt.show()
Total running time of the script: (0 minutes 0.195 seconds)