Note
Go to the end to download the full example code
Bed Instability 1D#
Plotting the dispersion relations corresponding to the one-dimensional dune bed instability.
import numpy as np
import matplotlib.pyplot as plt
from pydune.physics import bedinstability_1D as BI
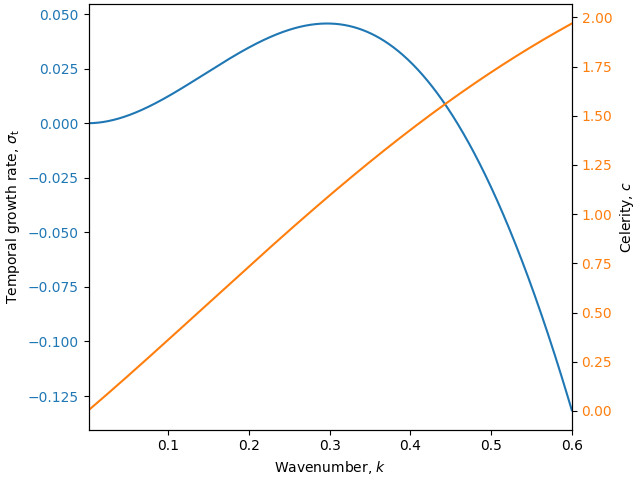
Temporal bed instability#
k = np.linspace(0.001, 0.6, 1000)
A0, B0, mu, r = 3.5, 2, 0.63, 2

sigma = sigma = BI.temporal_growth_rate(k, A0, B0, mu, r)
c = BI.temporal_velocity(k, A0, B0, mu, r)

fig, ax1 = plt.subplots(constrained_layout=True)

color = 'tab:blue'
ax1.plot(k, sigma, color=color)
ax1.set_xlabel('Wavenumber, $k$')
ax1.set_ylabel(r'Temporal growth rate, $\sigma_{\rm t}$')
ax1.tick_params(axis='y', labelcolor=color)
ax1.set_xlim(k.min(), k.max())

color = 'tab:orange'
ax2 = ax1.twinx()
ax2.plot(k, c, color=color)
ax2.set_ylabel(r'Celerity, $c$')
ax2.tick_params(axis='y', labelcolor=color)

plt.show()
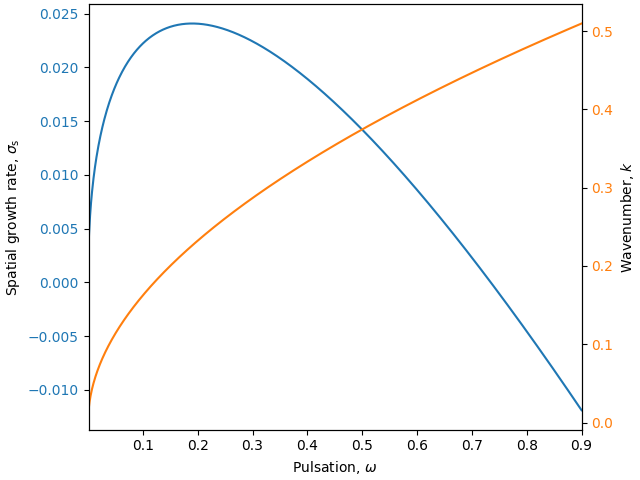
Spatial bed instability#
w = np.linspace(0.001, 0.9, 1000)
A0, B0, mu, r = 3.5, 2, 0.63, 2

k = BI.spatial_wavenumber(w, A0, B0, mu, r)
sigma_s = BI.spatial_growth_rate(w, A0, B0, mu, r)

fig, ax1 = plt.subplots(constrained_layout=True)

color = 'tab:blue'
ax1.plot(w, sigma_s, color=color)
ax1.set_xlabel(r'Pulsation, $\omega$')
ax1.set_ylabel(r'Spatial growth rate, $\sigma_{\rm s}$')
ax1.tick_params(axis='y', labelcolor=color)
ax1.set_xlim(w.min(), w.max())

color = 'tab:orange'
ax2 = ax1.twinx()
ax2.plot(w, k, color=color)
ax2.set_ylabel(r'Wavenumber, $k$')
ax2.tick_params(axis='y', labelcolor=color)

plt.show()
Total running time of the script: (0 minutes 0.407 seconds)