Note
Go to the end to download the full example code
Bed Instability 2D – Gadal et al. 2019#
Here, we recompute some of the results corresponding to the two-dimensional dune instability present in:
Gadal, C., Narteau, C., Du Pont, S. C., Rozier, O., & Claudin, P. (2019). Incipient bedforms in a bidirectional wind regime. Journal of Fluid Mechanics, 862, 490-516.
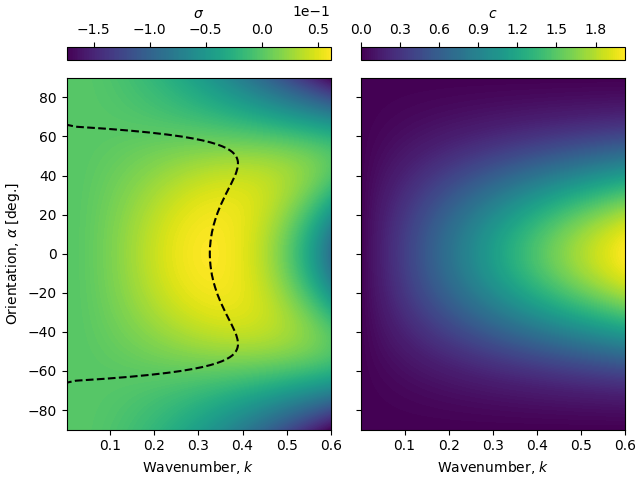
Celerity and growth rate under a unidirectional wind#
We fix needed paremeters:
# parameter space exploration (k -- alpha)
k, alpha = np.linspace(0.001, 0.6, 2000), np.linspace(-90, 90, 181)
K, ALPHA = np.meshgrid(k, alpha)
# constant parameters
A0, B0 = 3.5, 2
r, mu, delta = 2.5, tand(35), 0
We choose an expression for the hydrodynamics coefficients:
We compute the non-dimensional growth rate and celerity:
SIGMA = BI.temporal_growth_rate(K, ALPHA, Ax, Ay, Bx, By, r, mu, delta)
CELERITY = BI.temporal_celerity(K, ALPHA, Ax, Ay, Bx, By, r, mu, delta)

fig, axarr = plt.subplots(1, 2, constrained_layout=True, sharex=True, sharey=True)

cf = axarr[0].contourf(K, ALPHA, SIGMA, 200)
cb = fig.colorbar(cf, label=r'$\sigma$', location='top', ax=axarr[0],
                  ticks=np.linspace(-1.5, 0.5, 5)*1e-1)
cb.ax.ticklabel_format(axis='x', style='sci', scilimits=(0.1, 9))
axarr[0].plot(k[SIGMA.argmax(axis=1)], alpha, 'k--')

#
cf = axarr[1].contourf(K, ALPHA, CELERITY, 200)
cb = fig.colorbar(cf, label=r'$c$', location='top', ax=axarr[1],
                  ticks=np.linspace(0, 1.8, 7))
cb.ax.ticklabel_format(axis='x', style='sci', scilimits=(0.1, 9))


axarr[0].set_xlabel('Wavenumber, $k$')
axarr[1].set_xlabel('Wavenumber, $k$')
axarr[0].set_ylabel(r'Orientation, $\alpha$ [deg.]')

Text(22.166999999999994, 0.5, 'Orientation, $\\alpha$ [deg.]')
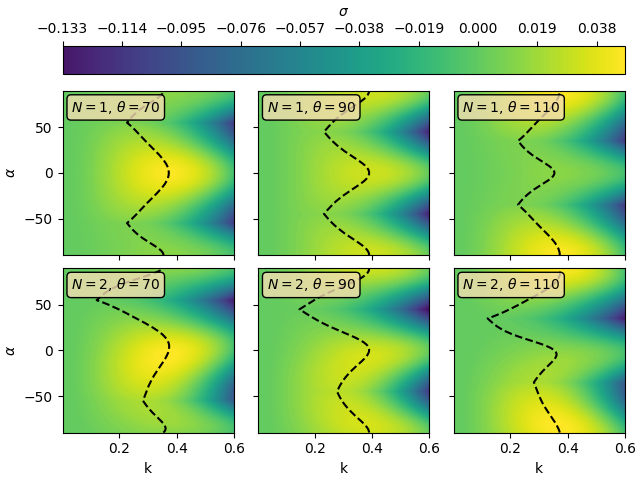
Growth rate under a bidirectional wind#
N = np.array([1, 2])
theta = np.array([70, 90, 110])

SIGMAS = BI.growth_rate_bidi(K[..., None, None], ALPHA[..., None, None], Ax, Ay, Bx, By,
                             r, mu, delta, theta[None, None, :, None], N[None, None, None, :])

print('The shape of SIGMAS is {}'.format(SIGMAS.shape))
vmax, vmin = SIGMAS.max(), SIGMAS.min()

fig, axarr = plt.subplots(2, 3, constrained_layout=True, sharex=True, sharey=True)
for i, n in enumerate(N):
    for j, th in enumerate(theta):
        ax = axarr[i, j]
        cf = ax.contourf(K, ALPHA, SIGMAS[..., j, i], 200, vmin=vmin, vmax=vmax)
        ax.plot(k[SIGMAS[..., j, i].argmax(axis=1)], alpha, 'k--')
        ax.text(0.05, 0.95, r'$N = {}$, $\theta = {}$'.format(n, th), ha='left',
                va='top', transform=ax.transAxes,
                bbox=dict(facecolor=to_rgba('wheat', 0.8), edgecolor='black', boxstyle='round'))

fig.colorbar(cf, ax=axarr, location='top', label=r'$\sigma$')
for ax in axarr[:, 0].flatten():
    ax.set_ylabel(r'$\alpha$')
for ax in axarr[-1, :].flatten():
    ax.set_xlabel(r'k')

plt.show()

The shape of SIGMAS is (181, 2000, 3, 2)
Total running time of the script: (0 minutes 9.656 seconds)