pydune.data_processing.plot_flux_rose#
- plot_flux_rose(angles, distribution, ax, fig, nsector=20, label_flux=False, label_angle=False, label=None, props={'boxstyle': 'round', 'edgecolor': (1, 1, 1, 1), 'facecolor': (1, 1, 1, 0.9), 'pad': 0}, blowfrom=False, **kwargs)[source]#
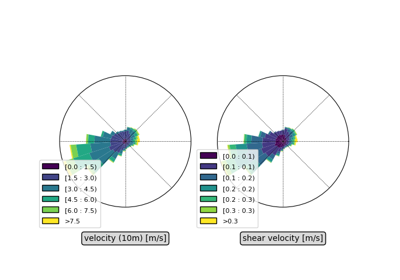
Plot a sand flux angular distribution, or flux rose, on the given axe of the given figure.
- Parameters:
angles (numpy array) – bin centers of the angular sand flux distribution, in degrees. Here, the angles show where the wind blows to, are anticlockwise and the 0 it a wind blowing to the East.
distribution (numpy array) – sand flux angular distribution.
ax (matplotlib.Axes) – axe of the figure that will be replaced by the flux rose.
fig (matplotlib.figure) – figure on which the flux rose is plotted.
nsector (int) – number of angular bins for the flux rose (the default is 20).
label_flux (bool) – if True, labels the radial axis (the default is False).
label_angle (bool) – if True, label the angles (the default is False).
label (str, None) – if provided, labels the flux rose with the given string (the default is None).
props (dict) – Bbox properties used around the label (the default is dict(boxstyle=’round’, facecolor=(1, 1, 1, 0.9), edgecolor=(1, 1, 1, 1), pad=0)).
blowfrom (bool) – If blow from, the rose will be \(\pi\)-rotated, to show where the fluxes come from (the default is False).
**kwargs (other kwargs) – any other parameter supported by
windrose.WindroseAxes.bar
- Returns:
return the axe on which the wind rose is plotted. Can be used for further modifications.
- Return type:
WindroseAxes
Examples using pydune.data_processing.plot_flux_rose#
From wind data to sand fluxes and dune orientations